Verify RestClient traceparent Propagation in Spring Boot 4.2
On this page
Use the RestClient.Builder that Spring Boot injects to follow a product lookup and its inventory call in one trace. In this example, the client built with RestClient.create() looks up the same product and also returns HTTP 200. The inventory API receives no traceparent header and starts a separate trace. Compare the HTTP responses and the spans stored in Tempo to find where the trace context stops propagating. Spring Boot trace propagation documentation
This exercise builds on the product lookup in the RestClient migration guide. The HTTP metrics guide counts requests. Here, you follow the path of a single request.
The header that connects product and inventory lookups
traceparent is the W3C standard HTTP header for propagating trace context. The header in this exercise has the form 00-<trace-id>-<parent-id>-<trace-flags>. The trace-id identifies the whole trace. The parent-id identifies the sender’s HTTP client span so the receiving service can use it as the parent of its server span. W3C Trace Context specification
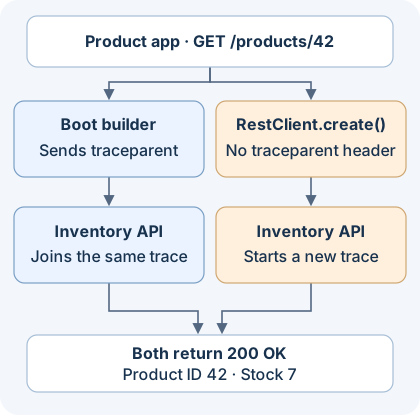
The diagram shows the two client paths for product 42. Both return the same stock value. The traceparent header determines whether the inventory server span joins the product trace in this example.
Run the same JAR as two apps
You’ll need JDK 21, Maven, Docker, curl, and jq. The exercise uses local ports 13200, 14318, 18180, and 18181. Create the following files in an empty directory. Run the same JAR twice, once with the service name product and once with inventory. The example includes the current trace IDs and the received header in the response so you can inspect them.
pom.xml
<project xmlns="http://maven.apache.org/POM/4.0.0">
    <modelVersion>4.0.0</modelVersion>
    <parent>
        <groupId>org.springframework.boot</groupId>
        <artifactId>spring-boot-starter-parent</artifactId>
        <version>4.2.0</version>
    </parent>
    <groupId>example</groupId>
    <artifactId>trace-propagation</artifactId>
    <version>1.0.0</version>
    <properties>
        <java.version>21</java.version>
    </properties>
    <dependencies>
        <dependency>
            <groupId>org.springframework.boot</groupId>
            <artifactId>spring-boot-starter-webmvc</artifactId>
        </dependency>
        <dependency>
            <groupId>org.springframework.boot</groupId>
            <artifactId>spring-boot-starter-restclient</artifactId>
        </dependency>
        <dependency>
            <groupId>org.springframework.boot</groupId>
            <artifactId>spring-boot-starter-opentelemetry</artifactId>
        </dependency>
    </dependencies>
    <build>
        <plugins>
            <plugin>
                <groupId>org.springframework.boot</groupId>
                <artifactId>spring-boot-maven-plugin</artifactId>
            </plugin>
        </plugins>
    </build>
</project>
src/main/java/example/TraceApplication.java
package example;

import io.micrometer.tracing.Tracer;
import org.springframework.beans.factory.annotation.Value;
import org.springframework.boot.SpringApplication;
import org.springframework.boot.autoconfigure.SpringBootApplication;
import org.springframework.web.bind.annotation.GetMapping;
import org.springframework.web.bind.annotation.PathVariable;
import org.springframework.web.bind.annotation.RequestHeader;
import org.springframework.web.bind.annotation.RequestParam;
import org.springframework.web.bind.annotation.RestController;
import org.springframework.web.client.RestClient;

@SpringBootApplication
public class TraceApplication {
    public static void main(String[] args) {
        SpringApplication.run(TraceApplication.class, args);
    }
}

@RestController
class ProductController {
    private final RestClient bootClient;
    private final RestClient directClient;
    private final Tracer tracer;

    ProductController(RestClient.Builder builder, Tracer tracer,
            @Value("${inventory.base-url}") String inventoryUrl) {
        this.bootClient = builder.baseUrl(inventoryUrl).build();
        this.directClient = RestClient.create(inventoryUrl);
        this.tracer = tracer;
    }

    @GetMapping("/products/{id}")
    ProductReply product(@PathVariable("id") long id,
            @RequestParam("instrumented") boolean instrumented) {
        RestClient client = instrumented ? bootClient : directClient;
        InventoryReply inventory = client.get().uri("/items/{id}", id)
            .retrieve().body(InventoryReply.class);
        return new ProductReply(tracer.currentSpan().context().traceId(), inventory);
    }
}

@RestController
class InventoryController {
    private final Tracer tracer;

    InventoryController(Tracer tracer) {
        this.tracer = tracer;
    }

    @GetMapping("/items/{id}")
    InventoryReply item(@PathVariable("id") long id,
            @RequestHeader(name = "traceparent", required = false) String traceparent) {
        return new InventoryReply(id, 7, traceparent, tracer.currentSpan().context().traceId());
    }
}

record ProductReply(String productTraceId, InventoryReply inventory) {}
record InventoryReply(long id, int stock, String traceparent, String inventoryTraceId) {}
src/main/resources/application.properties
server.address=127.0.0.1
inventory.base-url=http://127.0.0.1:18181
management.tracing.sampling.probability=1.0
management.opentelemetry.tracing.export.otlp.endpoint=http://127.0.0.1:14318/v1/traces
management.otlp.metrics.export.enabled=false
The sampling probability of 1.0 records all requests in this exercise. The apps export only traces over OTLP. Start by checking the HTTP response for the header so you can diagnose missing spans in Tempo separately from propagation. Spring Boot sampling documentation
tempo.yaml
This config lets Tempo receive spans over OTLP HTTP and write them to local storage. The query API and receiver ports are exposed only on the host’s loopback address.
server:
  http_listen_port: 3200

distributor:
  receivers:
    otlp:
      protocols:
        http:
          endpoint: 0.0.0.0:4318

storage:
  trace:
    backend: local
    wal:
      path: /tmp/tempo/wal
    local:
      path: /tmp/tempo/blocks
Start Tempo and the apps from the project root. Start Tempo in the first terminal.
docker run --rm --name traceparent-tempo \
  -p 127.0.0.1:13200:3200 -p 127.0.0.1:14318:4318 \
  --mount "type=bind,source=$PWD/tempo.yaml,target=/etc/tempo.yaml,readonly" \
  grafana/tempo:2.9.0 -config.file=/etc/tempo.yaml
In a separate terminal, confirm that curl -fsS http://127.0.0.1:13200/ready succeeds, then build with Maven. Run the two java commands in separate terminals.
mvn package

java -jar target/trace-propagation-1.0.0.jar \
  --spring.application.name=inventory --server.port=18181

java -jar target/trace-propagation-1.0.0.jar \
  --spring.application.name=product --server.port=18180
Compare headers and trace IDs in the responses
Once both apps have started, look up the same product twice. Change only instrumented to select the client.
curl -fsS 'http://127.0.0.1:18180/products/42?instrumented=true' -o boot.json
curl -fsS 'http://127.0.0.1:18180/products/42?instrumented=false' -o direct.json

jq '{id: .inventory.id, stock: .inventory.stock,
     headerReceived: (.inventory.traceparent != null),
     sameTrace: (.productTraceId == .inventory.inventoryTraceId)}' boot.json direct.json
jq -r .inventory.traceparent boot.json
Both requests returned HTTP 200. With the Boot builder, both apps had the same trace ID, and the traceparent header received by the inventory API contained that ID. With the directly created client, the inventory API reported traceparent as null and the two apps had different trace IDs.
| Client creation | Product ID and stock | Header received | Trace IDs across apps |
|---|---|---|---|
Boot-injected RestClient.Builder |
42 and 7 | Yes | Same |
RestClient.create() |
42 and 7 | No | Different |
Check the spans in Tempo
Query Tempo with the trace IDs from the responses. Span export can take a few seconds. If a trace is missing, wait briefly and run the query again. Grafana Tempo API for querying traces by ID
show_spans() {
  curl -fsS "http://127.0.0.1:13200/api/traces/$1" | jq -r '
    (.batches // .resourceSpans)[] as $batch
    | ($batch.resource.attributes[]
       | select(.key == "service.name").value.stringValue) as $service
    | $batch.scopeSpans[].spans[]
    | [$service, .kind, .name, .spanId, (.parentSpanId // "-")] | @tsv'
}

show_spans "$(jq -r .productTraceId boot.json)"
show_spans "$(jq -r .productTraceId direct.json)"
show_spans "$(jq -r .inventory.inventoryTraceId direct.json)"
The example ran on Spring Boot 4.2.0, JDK 21.0.1, Maven 3.9.11, and Tempo 2.9.0. The Tempo API returned the following spans for the three trace IDs from the two requests.
| Trace ID queried | Spans observed in Tempo |
|---|---|
| Request using the Boot builder | Product server → product HTTP client → inventory server |
| Product app on the direct-client request | One root product server span |
| Inventory app on the direct-client request | One root inventory server span |
On the Boot builder path, the inventory server’s parentSpanId in Tempo matched the product HTTP client’s spanId. The Tempo API response in this run encoded span IDs in Base64, while traceparent uses hexadecimal. Decoding the client span ID from Base64 and rendering the bytes in hexadecimal gave the same value as the header’s parent-id.
If requests succeed but a trace stops at a service boundary, check whether the receiving service gets traceparent. If the header is missing, check that the caller uses Boot’s configured builder. If the trace ID propagates and spans are missing from Tempo, check sampling and OTLP export settings. You can then use the same trace ID to find logs by following Connect logs and traces in Grafana LGTM.
Discussion